On this page

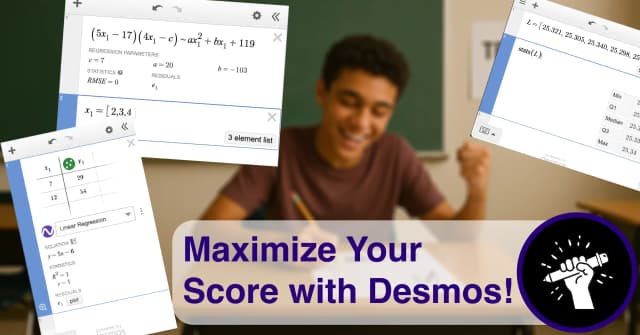
Master auto regressions, custom regressions, and the Tilde Trick to solve hard SAT math problems in seconds, including ones with those pesky "constants."
Desmos regressions are one of the most powerful tools on the SAT—yet most students never learn to use them properly. While most Desmos features help you solve medium-difficulty problems faster, regression techniques specifically target the hardest SAT questions—the ones that separate a 720 score from a perfect 800.
Even for students who understand the algebraic method, Desmos regressions will help you avoid careless algebra errors that can bring down your score. As long as you type it in correctly, Desmos gives you the right answer!
Ready to unlock Desmos's hidden power? Let's dive in! And once you master these techniques, practice them on our Desmos calculator or get real training with our free Desmos question bank (free account required)!
What are Regressions?
When you have a scatterplot of data points and you find the equation of the line of best fit, that's a "linear regression."
We'll be using regressions a bit differently in this post, but the basic idea remains the same...
Regression: an equation that best matches a given set of
What are Constants?
We see this term all over the SAT, especially in the questions we'll discuss today.
Constant: a fixed number, or a letter (such as a, b, or k) that stands for a fixed number
Note
"Variables," usually
Why Regressions Matter for Hard SAT Problems
The College Board intentionally writes certain problems to be extremely time-consuming with traditional algebra. This guide focuses on three game-changing regression techniques that will save you precious minutes on the test's toughest problems:
- Auto Regression from Points – Find standard equations instantly from a set of coordinate points
- Custom Regression – Find more unusual equation forms from a set of coordinate points
- Solve for Constants: The Tilde Trick – Find missing constants in equivalent expressions without algebra
With a regression, you can solve these "5-minute problems" in 30 seconds. That's not an exaggeration—that's the power of knowing these techniques.
Regressions from Points
Got points but need the equation? Ditch the algebra! Desmos's regression feature uses points to find the equation of a linear, quadratic, or exponential function with just a few clicks.
Method
- Create a Table: Click the "+" icon in the upper-left corner of Desmos and choose "Table".
- Input Your Points: Carefully enter your given
- Click the Regression Button: Look directly beside your table in the blue vertical bar. Click this :

Choose Your Model (if needed): Desmos will likely default to Linear Regression. If you need a different type (like Quadratic or Exponential), select it from the dropdown. Desmos calculates and displays the equation of best fit.
Example SAT problem
Practice question · Desmos Skills
Show the Detailed Explanation
Desmos Solution:

- Click the plus button to add a table.
- In the first table row, enter 7 under
- Click the regression button in the blue bar. Because the question tells us this is a "linear function," make sure Linear Regression is selected.
- Desmos instantly gives the equation:
The answer is Choice (B)! Quick and painless!
Custom Regressions from Points
This is where regression gets really powerful. Sometimes the SAT gives you points but asks for an equation in a specific form—one that doesn't match Desmos's standard regression options. That's when you define your own custom regression model.
When to Use This
Questions asking for equations in unusual forms such as...
Method
- Create a Table: Click the "+" icon in the upper-left corner of Desmos and choose "Table".
- Input Your Points: Carefully enter your given x-coordinates into the x₁ column and the corresponding y-coordinates into the y₁ column.
- Type the equation structure: Enter the desired equation format, using letters (such as
- Replace = with ~: That squiggly line is called a tilde (TILL-duh), and you can usually find it on the upper left corner of your keyboard. Using a tilde instead of an equals sign tells Desmos that this is a regression based on the given values of
- Replace
- Read "Regression Parameters": Desmos will now display the values for
Example SAT problem
Practice question · Desmos Skills
Show the Detailed Explanation
Desmos Solution

- Click the plus button to add a table.
- In the first table row, enter
- If you click the regression button, you will see that the exponential regression is in the wrong format! So, on a new line, we type a custom regression for the form the question asked for, replacing the = sign with a tilde (~) and replacing
- This gives us the values of
The answer is Choice (C)! So easy!
The Tilde Trick: Solve for Constants
This is the most powerful regression technique of all. When two expressions are supposed to be equal but one has unknown constants, the Tilde Trick finds those constants instantly—no expanding, no factoring, no algebra.
When to Use This
If the question asks: "If
Method
- Set up the equation: Type the full equation exactly as given, replacing any
- Provide test values: Give Desmos some values of
- Type
- Use at least as many numbers as unknown constants
- If the question limits the values of
- Read Regression Parameters: Desmos shows all constant values
Example SAT Problem
Practice question · Desmos Skills
Show the Detailed Explanation
Desmos Solution:

- Type:
- Type:
Question asks for
Other Uses of Regressions
Other sites may advise you use regressions to solve simple equations or systems of equations. Although there are some very rare questions where this method may be useful, we don't recommend it. It's always better to simplify your approach to the test. Find the most efficient method that works for the most number of questions. For basic solving, that means graphing, not regressions. See our comprehensive Desmos guide for details!
When Should You Use Each Regression Method?
Here's a quick decision tree:
Which regression to use
Given coordinate pairs + asked for an equation?
→ Use Auto Regression
Given coordinate pairs + equation is in unusual form?
→ Use Custom Regression
Two expressions are equal with missing constants?
→ Use Tilde Trick with Test Values
Practice Makes Perfect
These regression techniques seem magical at first, but learning a feature and actually making it a part of your standard workflow are two wildly different things. You need to practice daily until using regressions becomes second nature.
Also, regressions are just one piece of the Desmos puzzle. For complete mastery, check out our comprehensive guide to 8 essential Desmos features, which covers solving equations visually, finding maximums and minimums, using sliders for unknown constants, statistics functions, and more!
Take Your Skills to the Test
Ready to put these techniques into action? Practice with our free Desmos question bank (free account required), featuring problems specifically designed to test regression skills.
Then, master everything with Resolve Prep's complete SAT prep platform with 8 full-length SAT practice tests (1 free), a math-only test, and over 1,800 targeted practice problems covering all SAT Topics.
Stop losing points on hard SAT math problems. Start using regressions to solve them in seconds.
Level up your SAT prep at Resolve Prep!